Lost in Xcode land
A travelers guide.

Why is it that GUIs always seem to be the hardest part of any project? Particularly anything involving Xcode — there’s a lot going on here. Even worse than not finding something, it’s often hard to put into words what button you can’t find — so you can’t even search for it!
What follows is a non-exhaustive list of miscellaneous seemingly hidden buttons. It’s prepared for Xcode 11.5 —I’ll put off making the switch until the new version is out of beta.
Left, right, and bottom
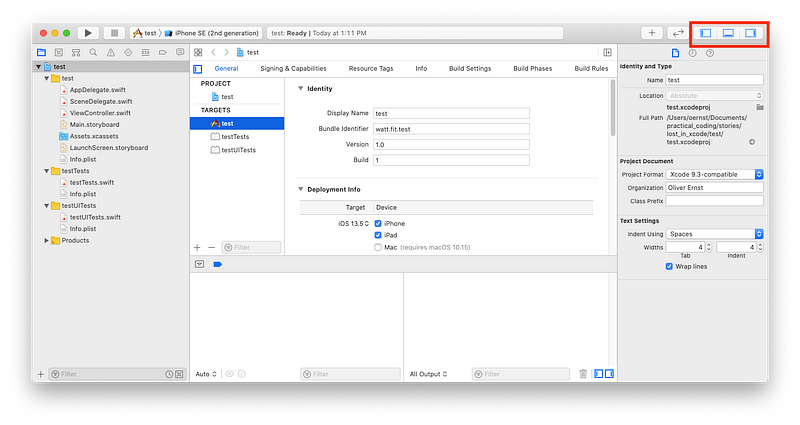
Let’s start with something easy:
- Left is the Navigator — ⌘0
- Botttom is the Debug area — ⇧⌘Y
- Right are the Inspectors — ⌥⌘0
It’s important to memorize these names, because many guides will often refer to them without a picture, assuming you know which one they mean.
They can all be controlled via the buttons on the top right.
Groups vs folders
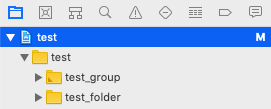
By default on the left you’ll see the Project navigator, with all your project files. In most projects you’ll see both folders in yellow (sometimes in blue?) and groups, also in yellow but with a little earmark on the bottom. What a tiny indication that they are different!
The difference is that:
- Folders correspond to actual folders on your Mac.
- Groups exist only in Xcode and don’t move the actual files they contain.
View the last edited file
Just like in a browser, you can go back and forth to previously viewed files using the arrows at the top of the file.
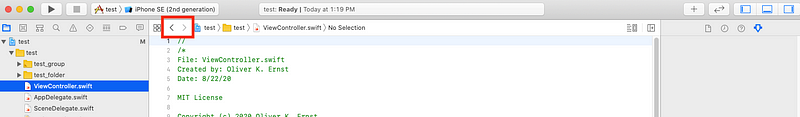
I know it’s trivial, but I didn’t take advantage of it for a while, and it’s actually very convenient! For example, if you navigate to another file to copy something, and then just want to go back to the previous file to paste it!
View headers and related files in the assistant editor
Let’s say you’re working on a C++ project and want to have the source and header files next to eachother. Or, if you’re working on an iOS project, let’s say you want to open the code for a ViewController next to the storyboard. You can open the assistant editor using the button on the top right of an open file.
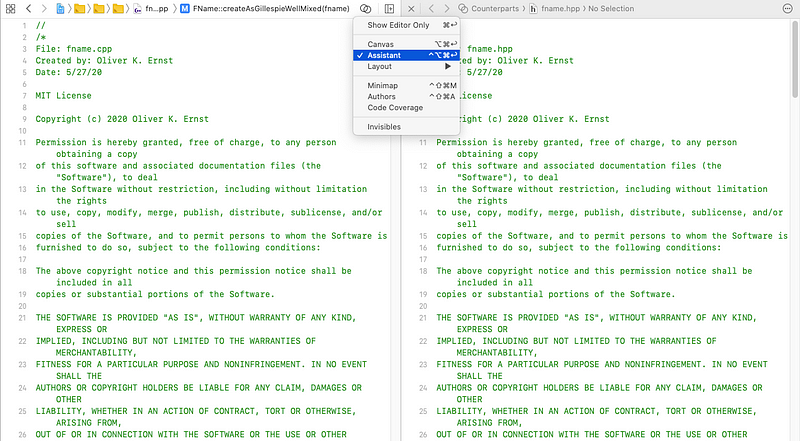
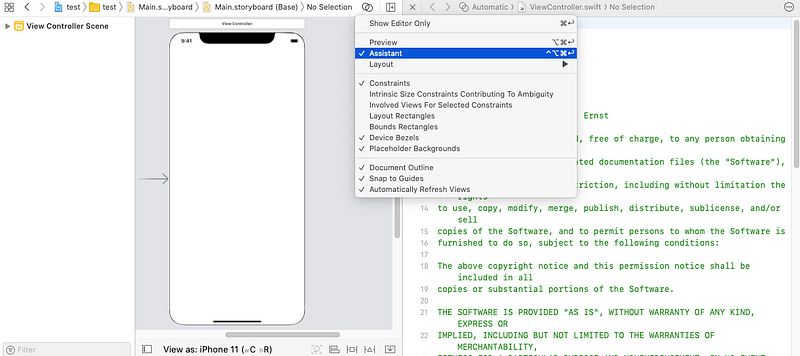
Note that it’s often strangely based on the filename (like matching src.cpp and src.hpp), and can be rather ignorant of the actual classes in the files.
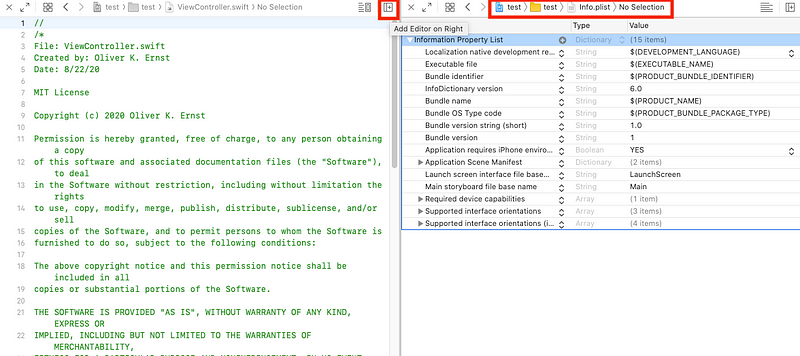
Adding/removing tabs
If you want to open two files next to each other which are unrelated, it’s better to use tabs than the assistant. Click the plus button on the top right of an open file. Switch the files by clicking their names at the top.
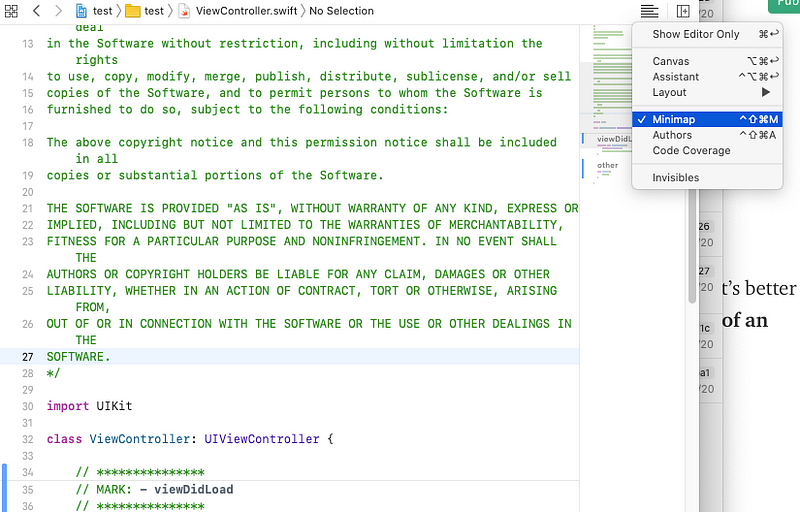
Minimap
In the same menu on the top right, you can open the minimap. It’s stolen from other editors like Sublime, but I find it absurdly useful for navigating big files!
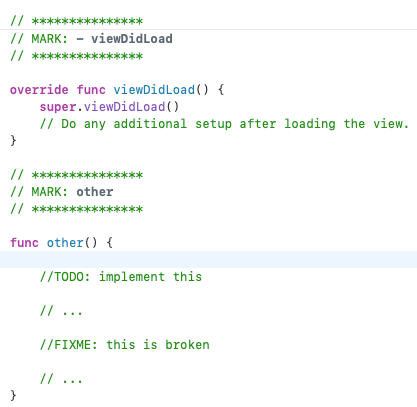
Mark, TODO, FIXME, and quickly navigating to other methods
In the minimap, you will also see headers (big text) and horizontal lines. You can create a header with the MARK comment. Another useful directive is the TODO directive. Although you can only view your TODO list by searching for the TODO string in the project, which is kind of a missed opportunity. Another one is the FIXME directive.
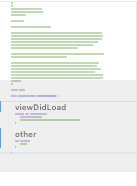
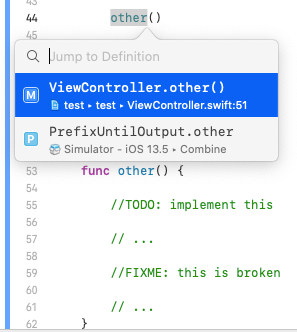
You can however view all the MARK , TODO , and FIXME sections, and maybe even better, all the methods in the file, by clicking on the methods at the top of the file.
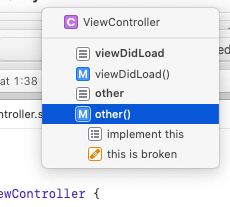
This is possible the best way to navigate through a big file! Or to gain an overview of someone else’s code.
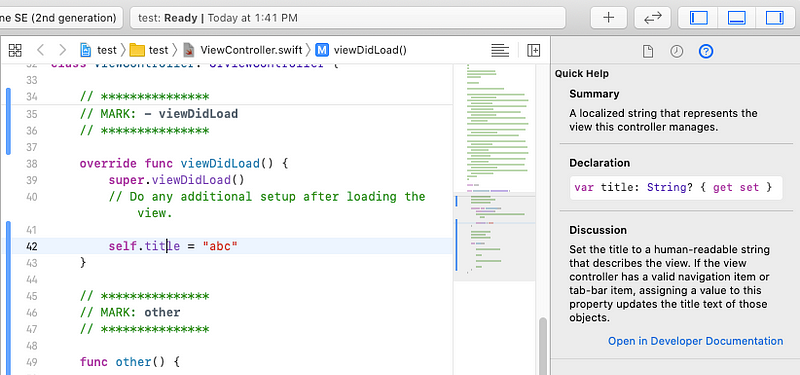
Reading documentation
You can read the documentation for a section by holding down the option key ⌥ and clicking on the piece of code.
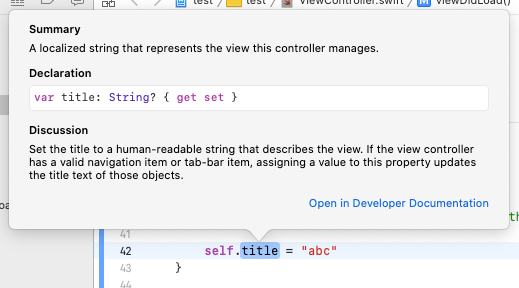
You can also use the Quick Help inspector in the Inspectors section on the right after you have put your cursor on the relevant code.
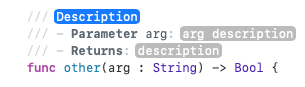
Writing documentation
Equally useful is writing documentation. You can generate the documentation template to fill out with by putting your cursor into the relevant method and pressing command-option-slash: ⌘⌥/.
Setting breakpoints
I set my first breakpoint by accident. If you’re reading this there’s a good chance you did too. You can set them by just clicking on the line numbers on the left.
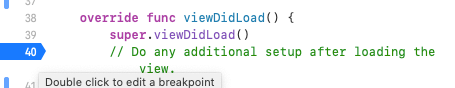
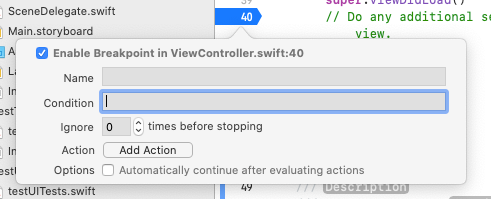
You can edit by double clicking the breakpoint.
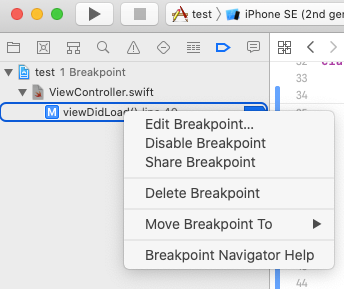
Removing breakpoints
Equally important is to remove breakpoints. One way is to just click and drag the breakpoint, throwing it away. This works OK for one or two breakpoints, but with breakpoints scattered through your project, its better to use the Breakpoint navigator in the navigator panel on the left.
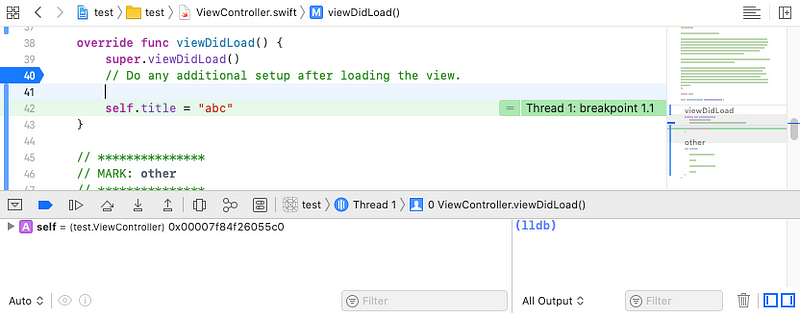
Stepping through breakpoints
This one’s more intuitive, but for completeness: to step through a breakpoint, look in the Variables View on the bottom left and use the Continue button.
There’s couple more crazy features here, but let’s leave them until later.
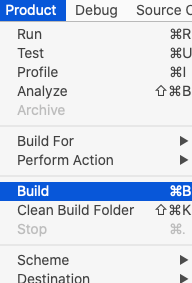
Build and clean
During development, more useful than running the program is building it with ⌘B, and occasionally cleaning the build folder with ⇧⌘K.
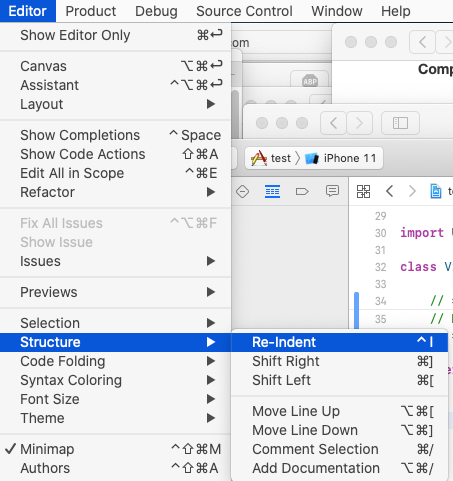
Re-indent code
Strangely hidden in a submenu, the re-indent code is needed for everyone’s sanity, and can be invoked with ⌃I.
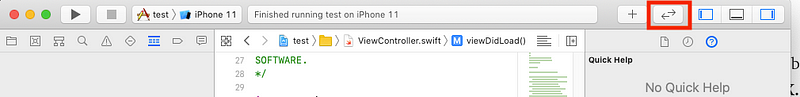
Source control — viewing changes
There’s several ways to do this. There’s the big button on the top right.
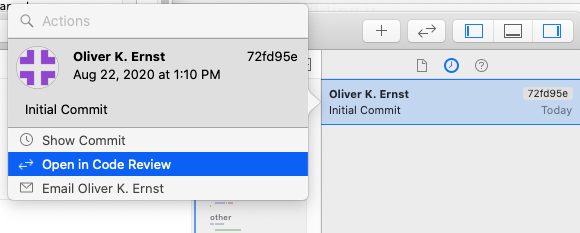
You can also use the History inspector on the right to view specific commits.
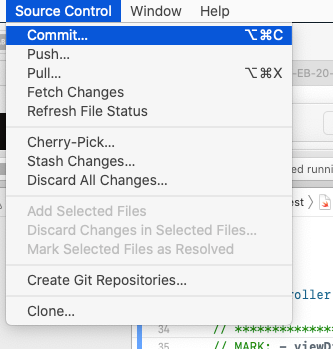
Source control — committing, pushing, pulling
Oh and there’s a big source control menu at the top, which lets you commit, push, pull, and even initialize a git repo for the project if you haven’t already used it.
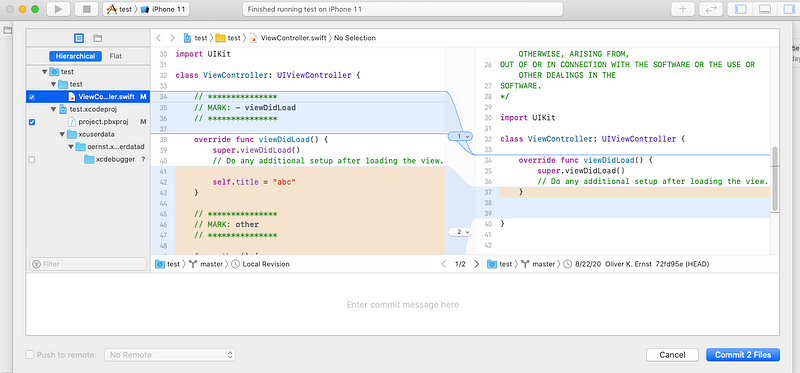
When you press commit, you get a nice menu where you can review the code differences, and add a commit message.
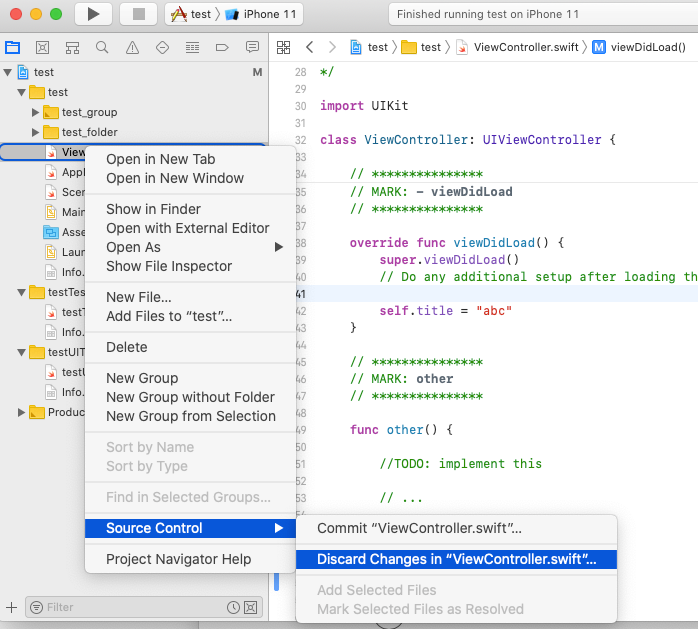
On the left in the project navigator, there’s symbols M for modified, A for new added file, etc. Here there’s also an easy way to discard changes in a file if you ever feel that need, by right clicking on the file.
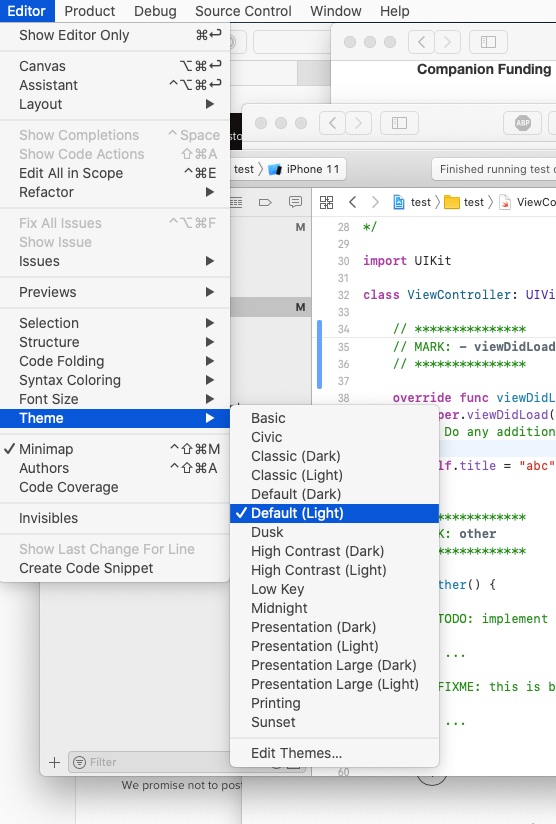
Colors and themes
You can switch colors and themes in the menu bar under Editor/Theme and Editor/Syntax Coloring .
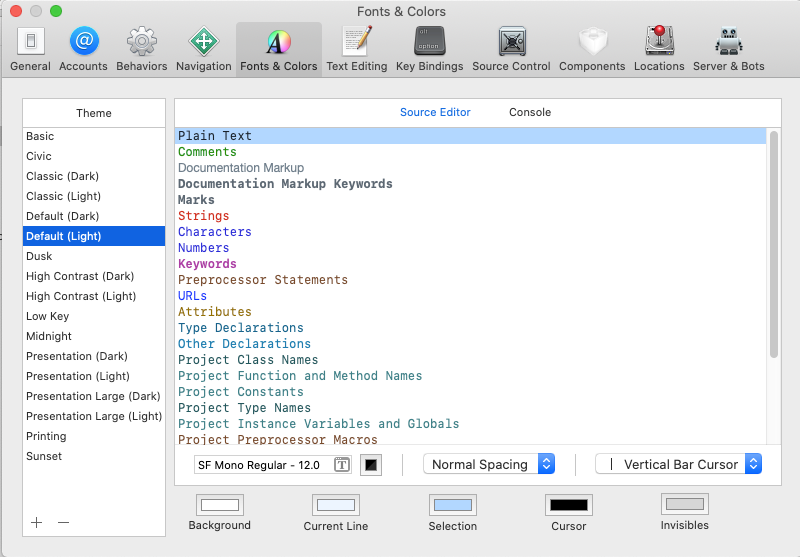
You can otherwise set the colors in the preferences to your liking.
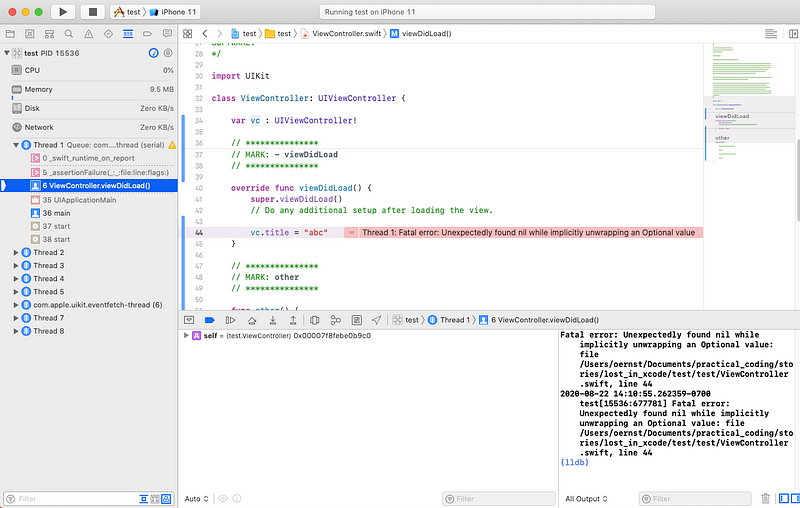
Stack trace
When your code inevitably fails, you can step through the executions in the Debug navigator on the left.
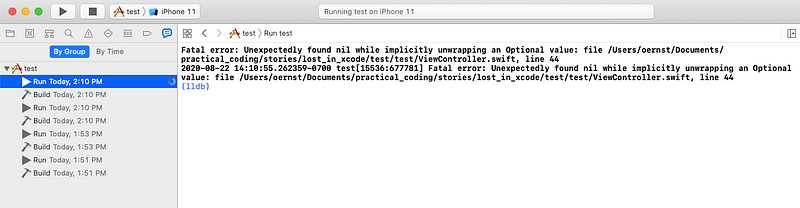
View previous errors in the Report navigator
You can view the results and errors of previous builds and runs in the Report navigator on the left.
Jump to line/definition
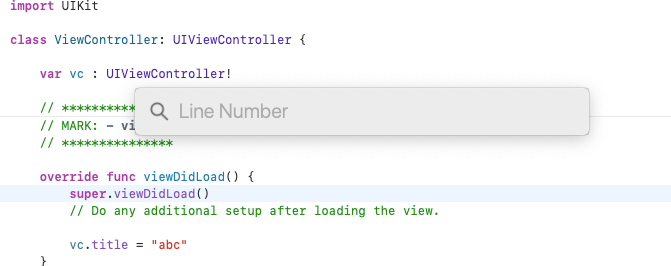
Probably you already know to use ⌘L to jump to a specific line.
Equally useful is to jump to a function definition using ⌃⌘J after you click on the method.
Bonus: Generate Xcode project from CMake project
Beyond Swift: Xcode is also great for other projects. Using CMake , you can generate an Xcode project using:
cmake .. -GXcode
Next, let’s get into some Swift/iOS specific parts. Storyboards are littered with buttons you can’t find.
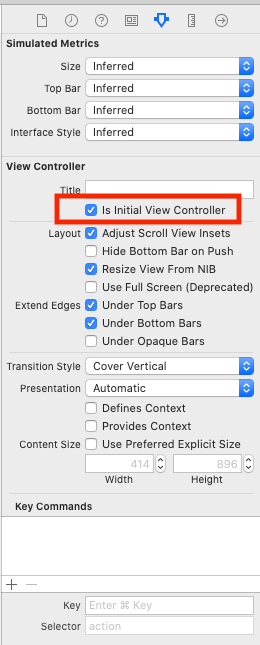
Changing the initial view controller
One way is to drag the default arrow around, but that always seems impossible if your project is big. Luckily there’s also a menu button if you click on the ViewController and select Is Initial View Controller.
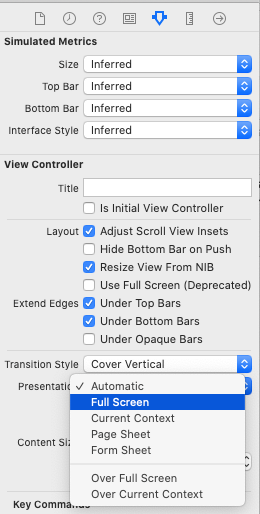
Popover vs full-screen
By default, new view controllers presented with a Show segue come as a page that doesn’t cover the full screen.
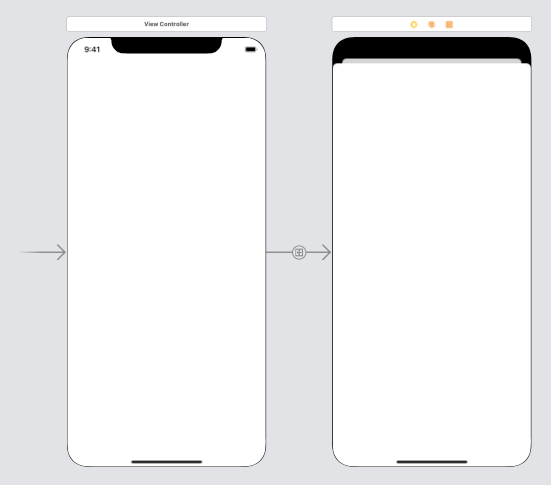
You can change this to cover the full screen by selecting Presentation/Full Screen on the right.
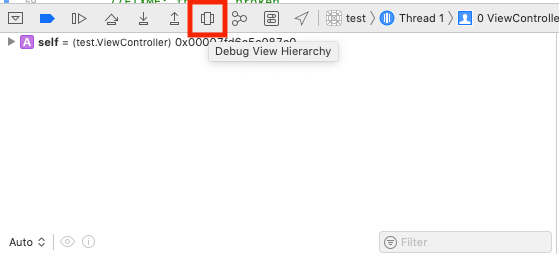
Debugging the view hierarchy
Back to the breakpoints — when you are in a breakpoint, you can debug the view hierarchy, which is a great way to figure out why your views aren’t showing correctly.
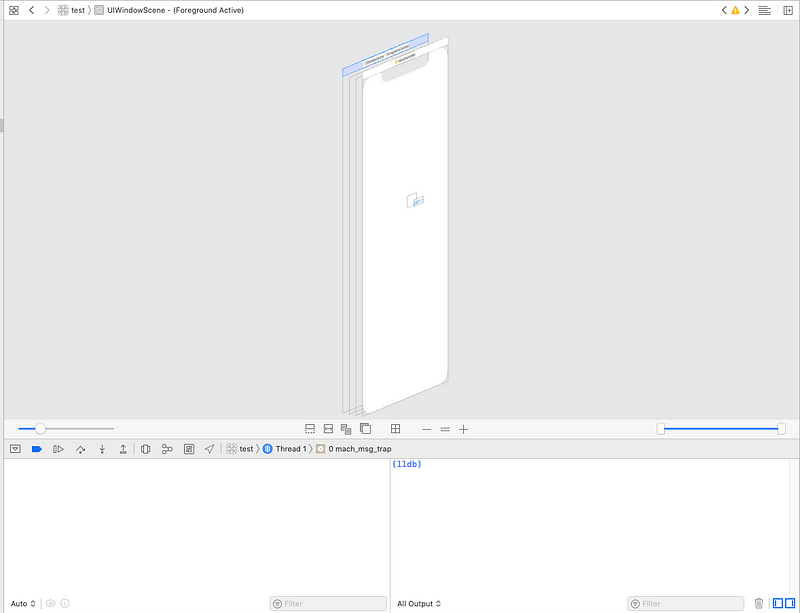
Wow that looks fancy!
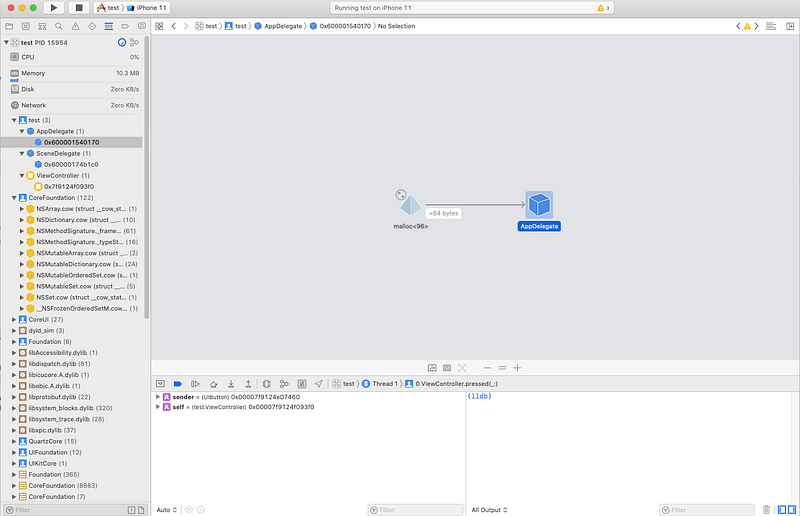
Memory graph
Just as crazy as the view hierarchy debugger has to be the memory graph — the button next to the view hierarchy one. It lets you investigate exactly who’s eating up resources.
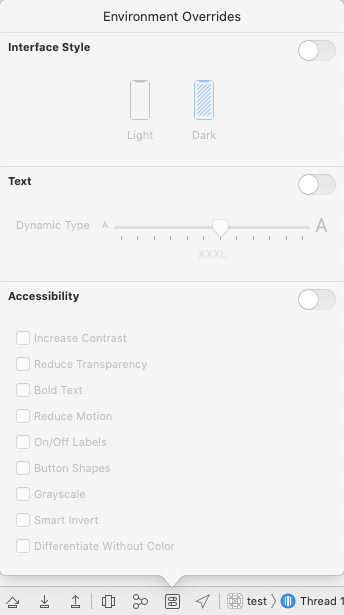
Environment overrides
A final very useful debugging tool is the environment overrides button, in the same row as the memory graph and the view hierarchy. It lets you change some features, mostly related to the views, mid-run of your program. For example, you can switch light and dark mode!
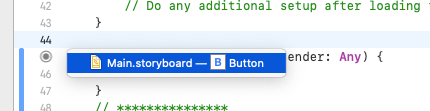
Jump from code to storyboard
Usually we go from UI elements and hook them up to the code.
But did you know you can jump directly back from the code to storyboard just by pressing the black connection button next to a reference?
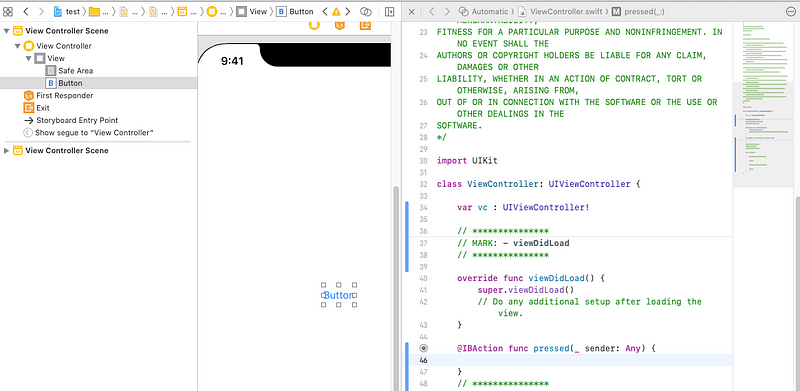
Hooking up code to the storyboard without the assistant
When you first go through tutorials on Swift, you are most often taught to use the assistant editor next to the storyboard to hook your code and references up to the storyboard. But if you are have the code (e.g. by copy pasting it from elsewhere), you can hook up the UI elements entirely in the storyboard by dragging from the elements to the view controller. This can be done in the view controller:

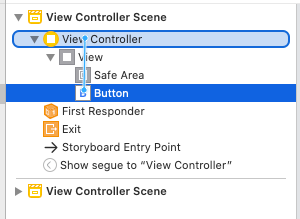
Or even in the list on the left:
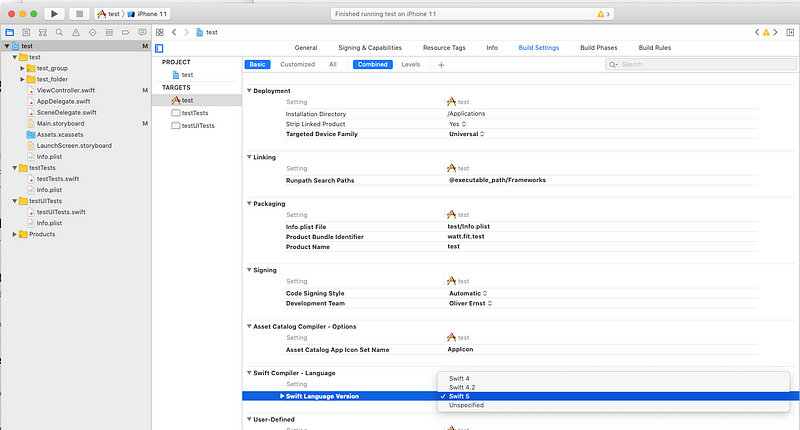
Changing the Swift version
Changing the Swift version comes up somewhat frequently on large projects, especially when it’s updated in a newer version of Xcode and you don’t feel like making the switch. You can change it in the project settings under Build Settings.
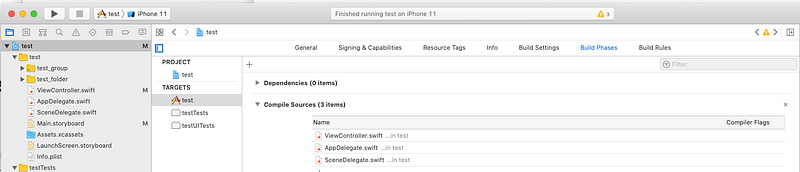
Adding/removing source files
Sometimes, you add a file to your project and for some reason or other it just doesn’t end up being compiled. Or maybe worse, you delete a file and Xcode complains that it’s still trying to build it. You can edit the Compile Sources in the projects Build Phases.
Final thoughts
There’s certainly a million more buttons and features not described here, but hopefully this will help orient someone a little.
We’re all great programmers on the inside — if only we could figure out how to operate these strange machines in front of us!
Contents
Oliver K. Ernst
August 22, 2020